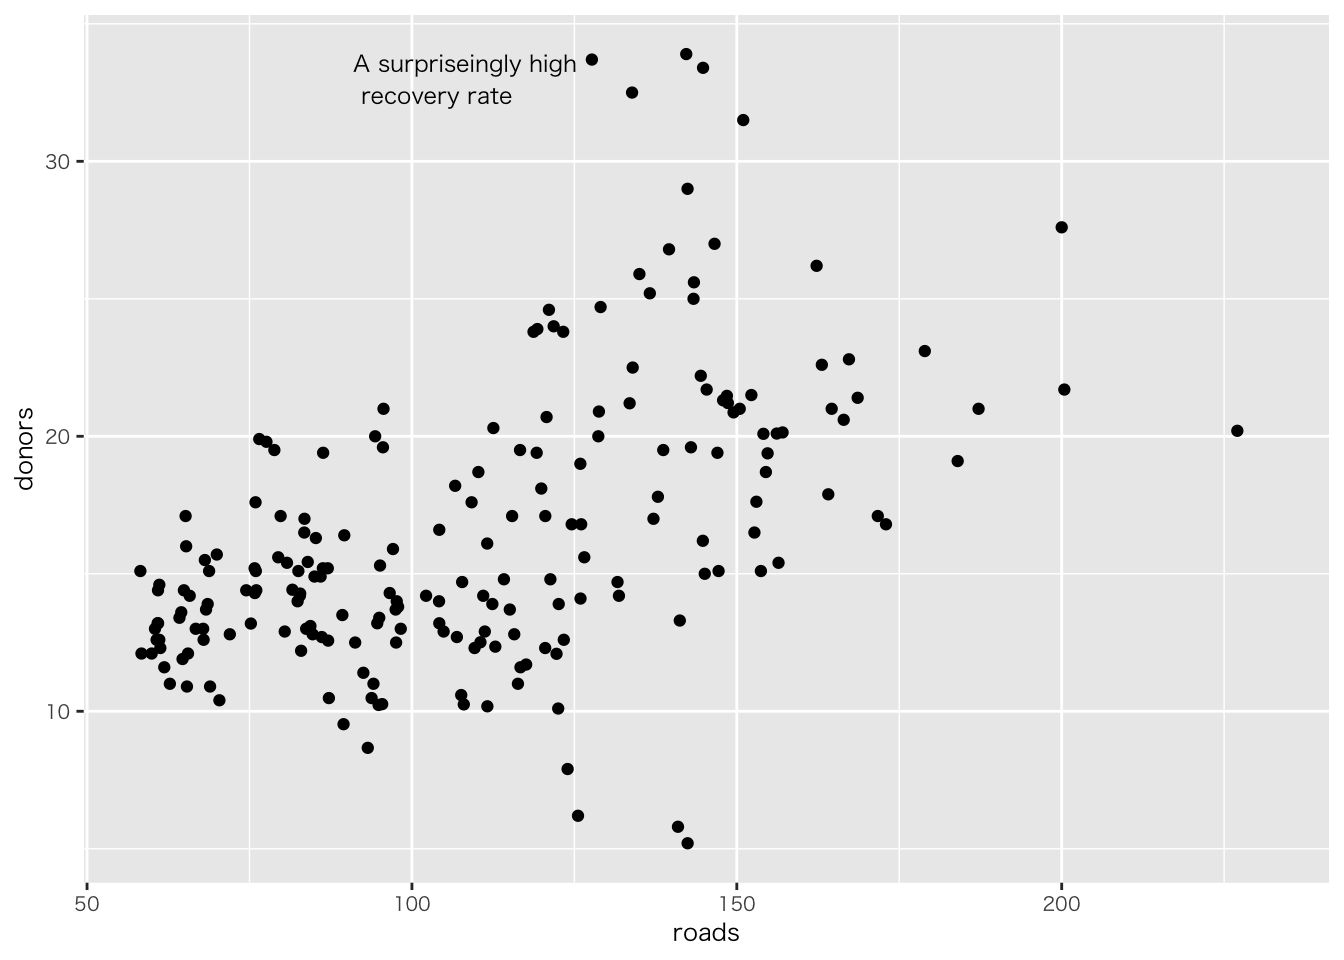
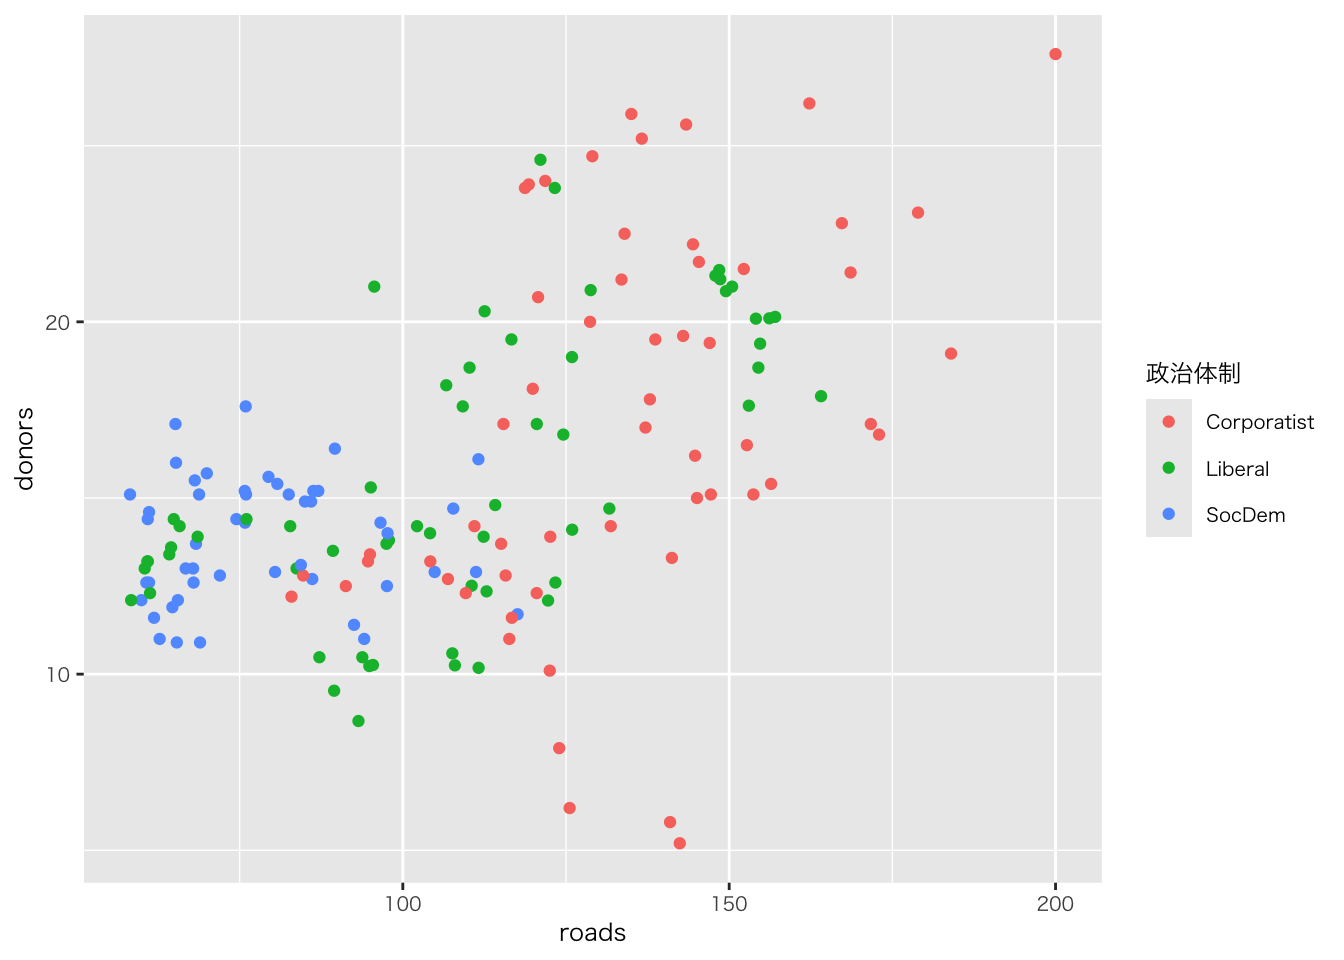
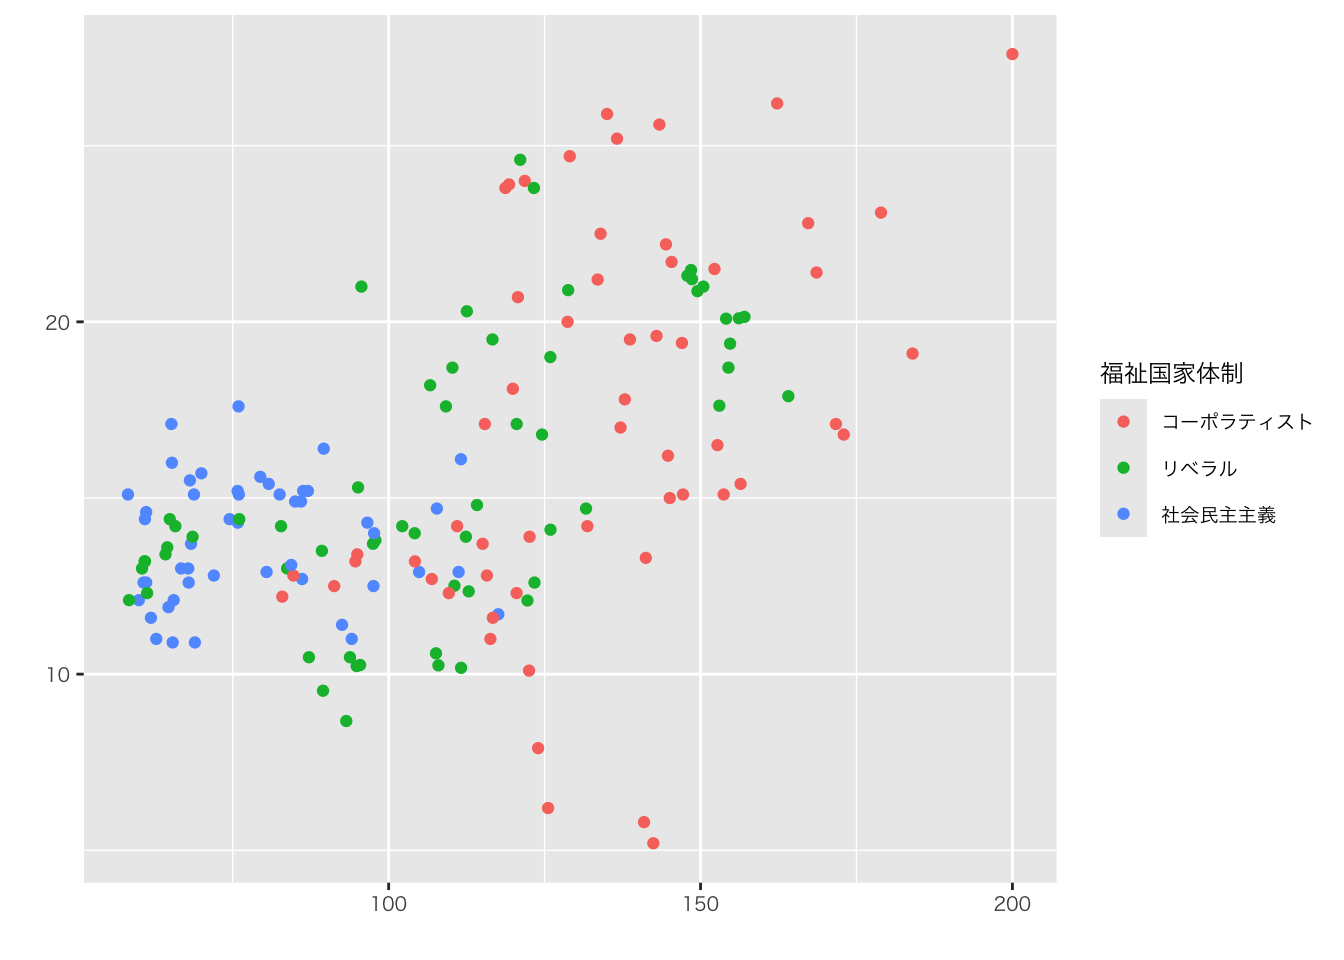
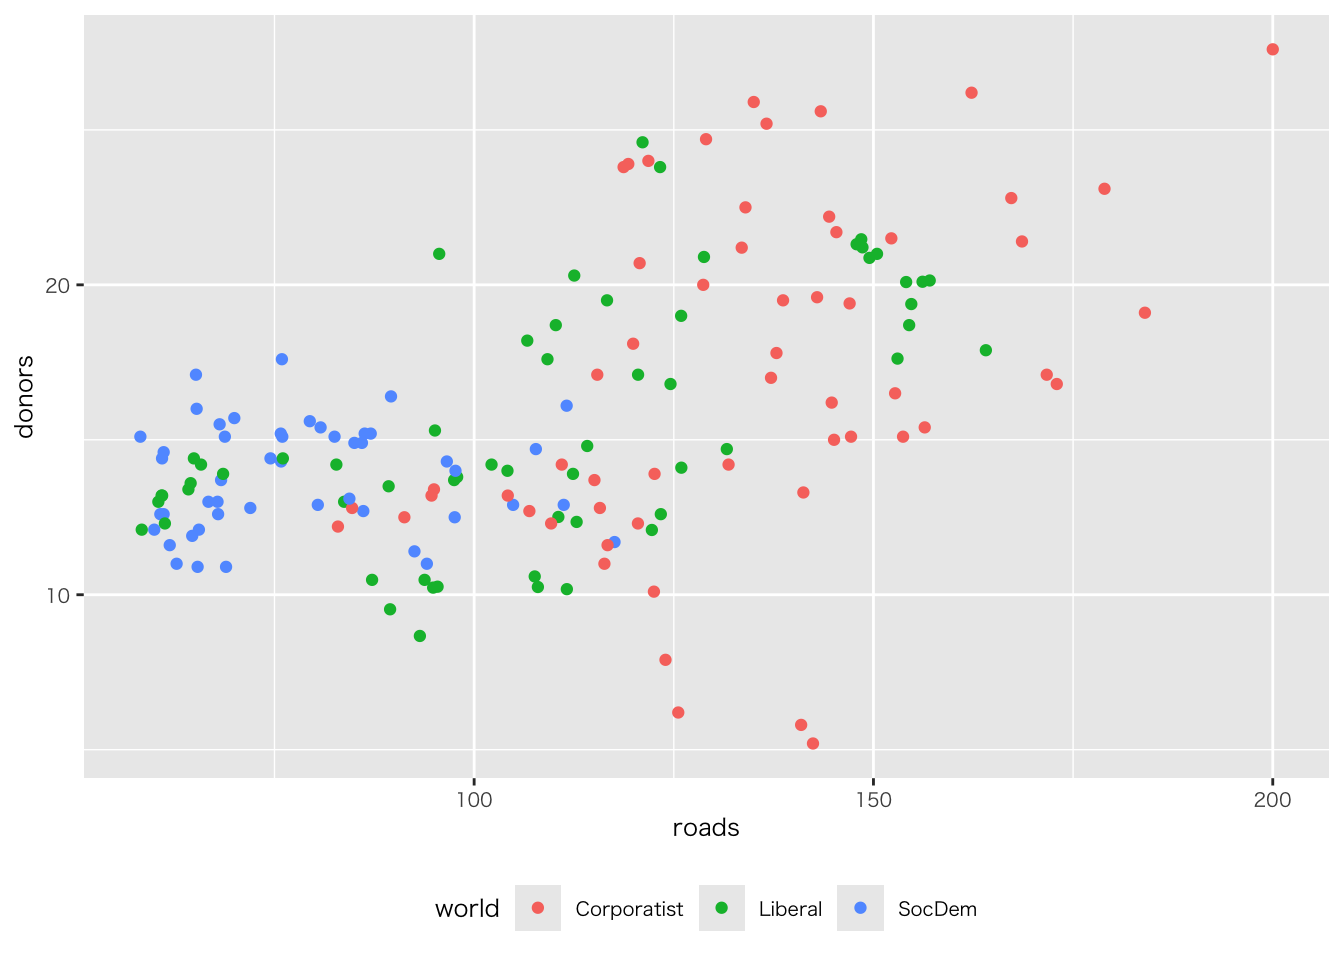
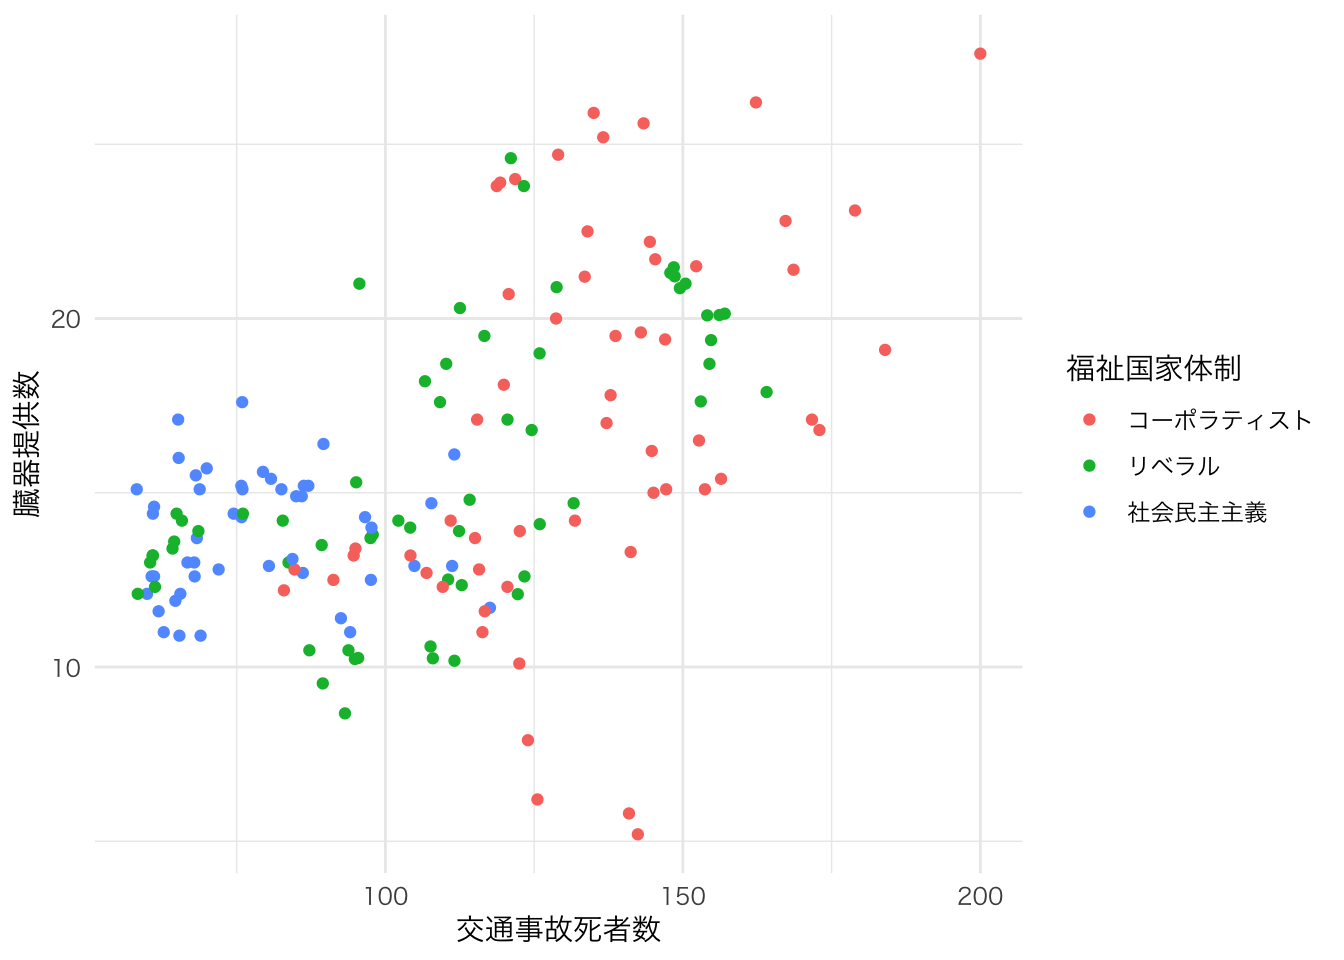
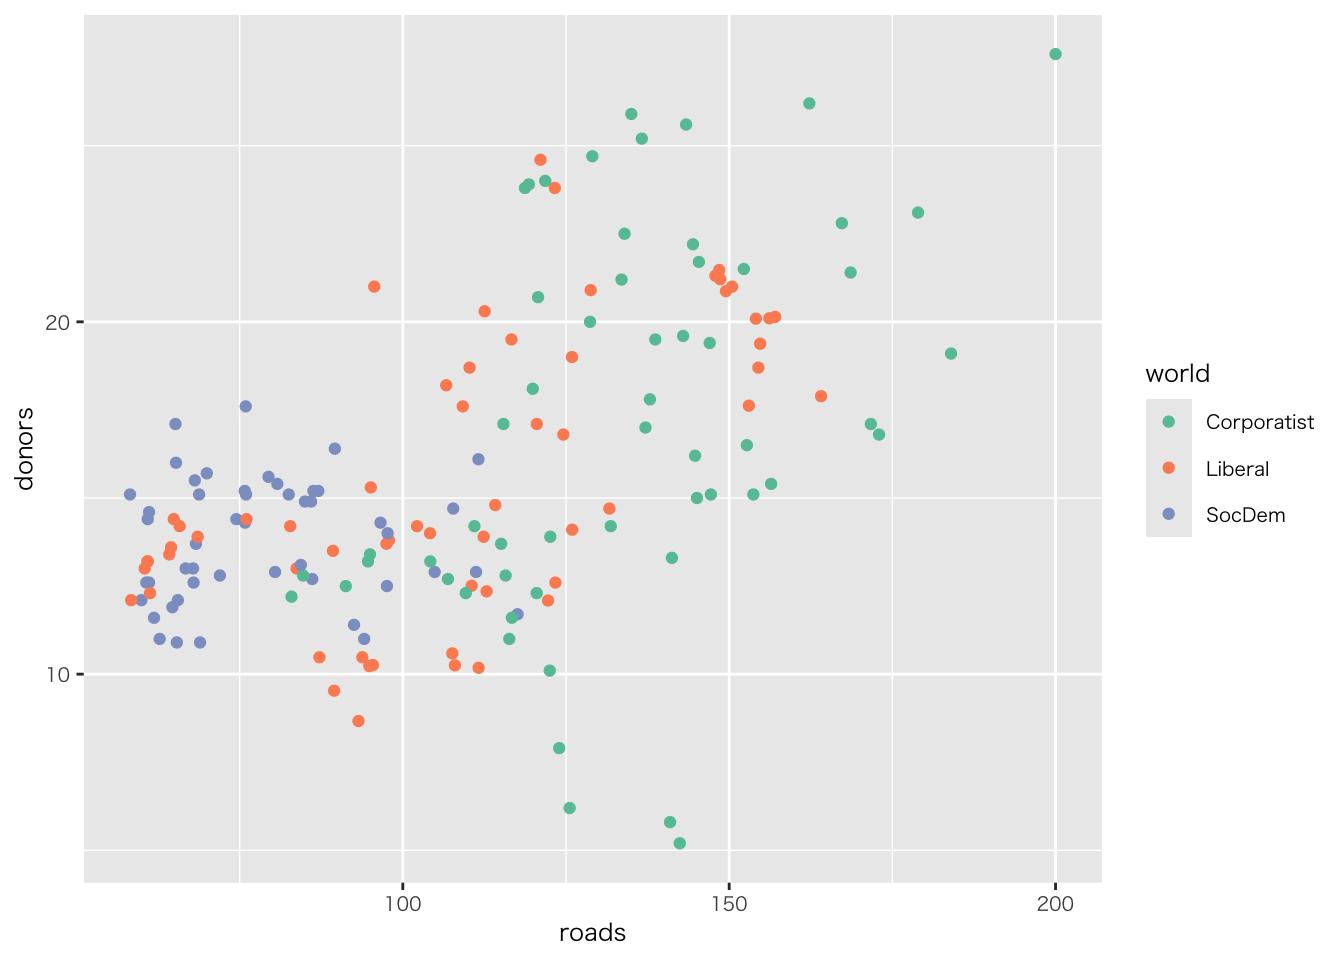
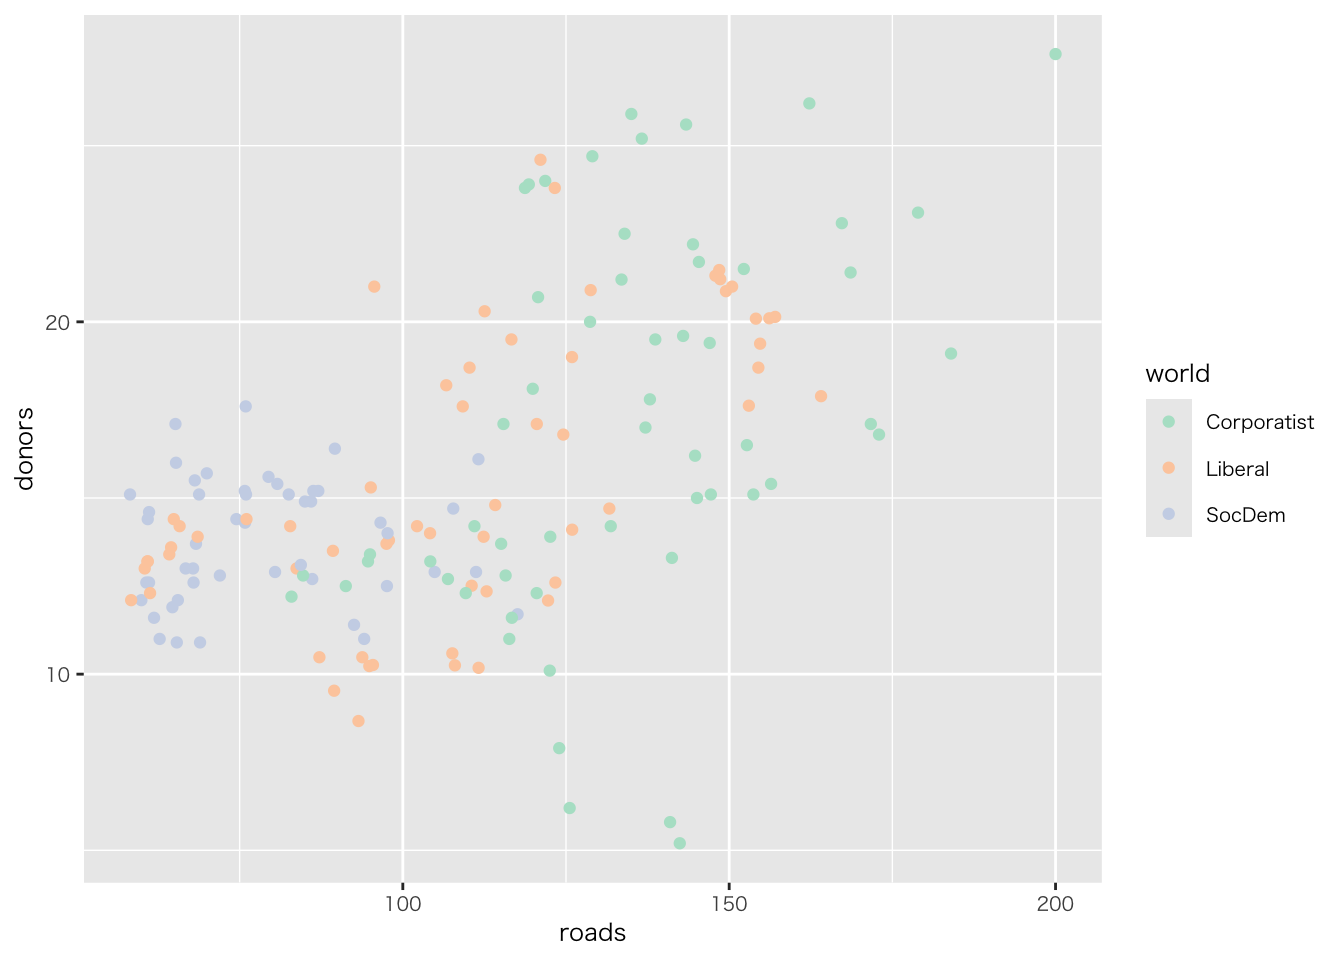
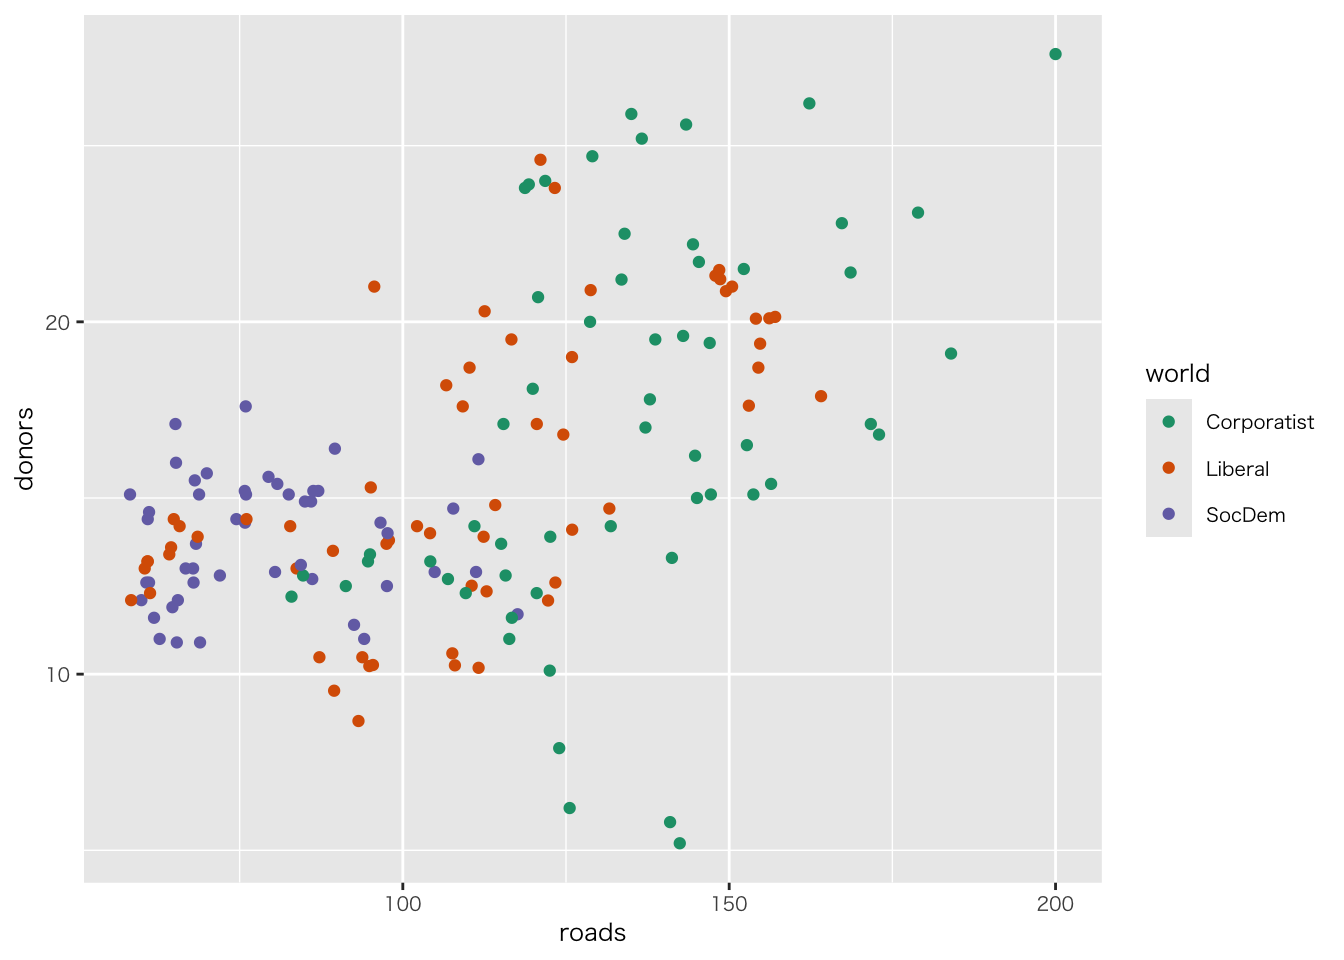
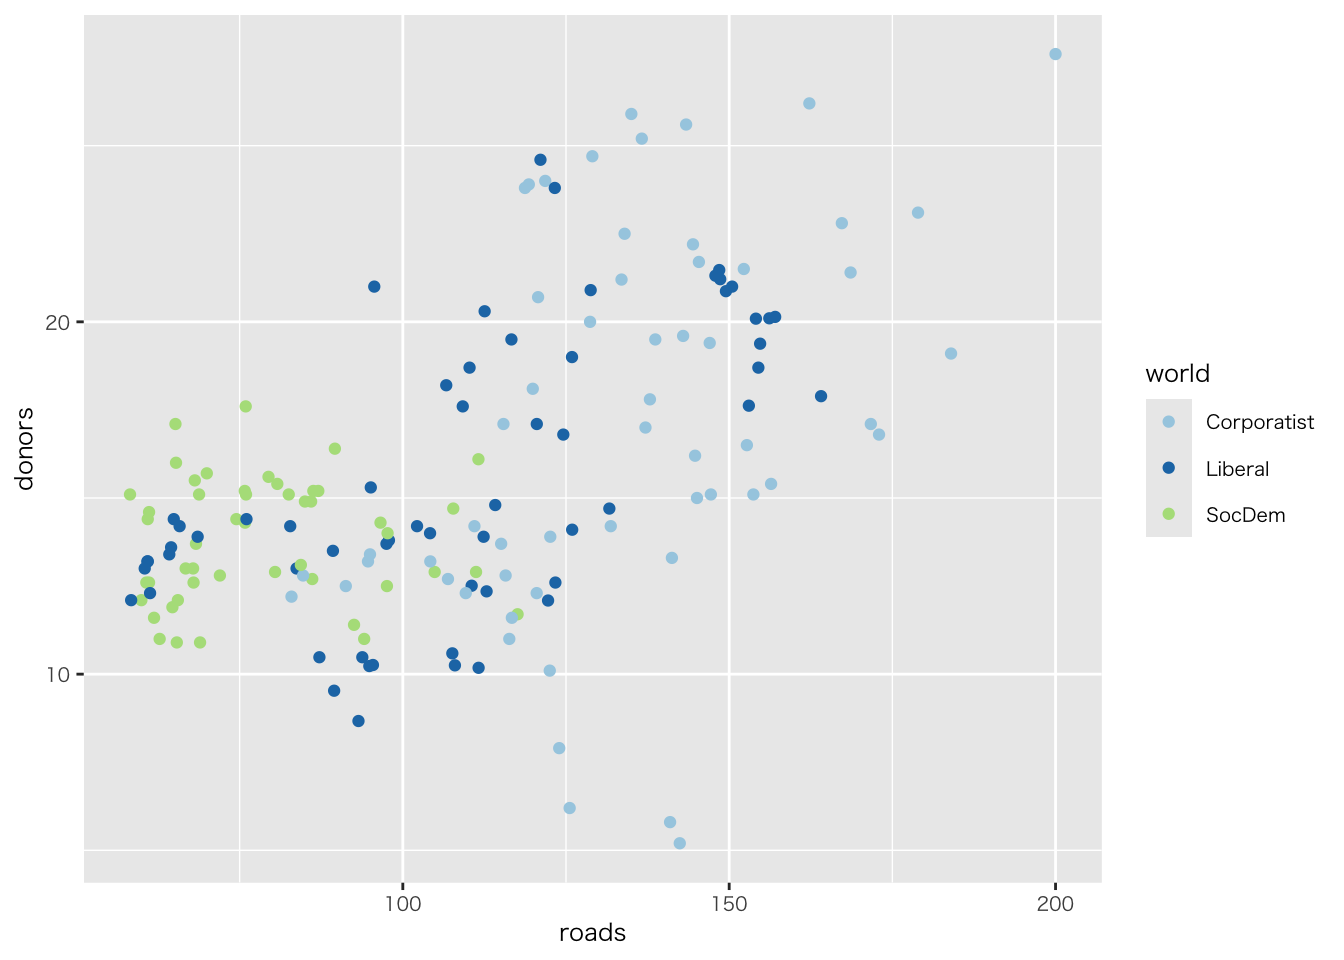
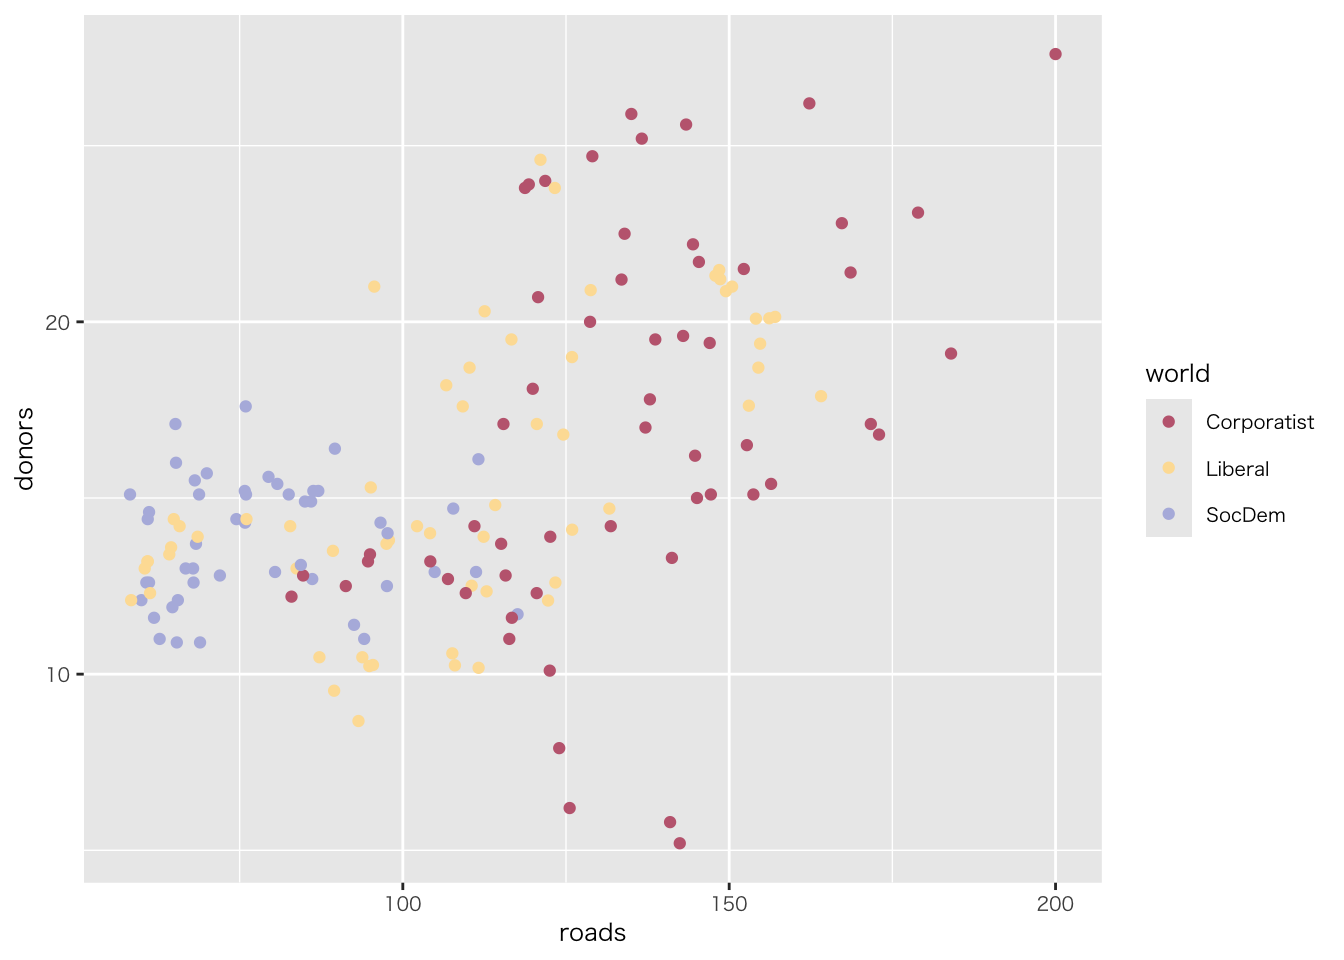
organdata |>
  ggplot(aes(x = roads, y = donors)) +
  geom_point() +
  annotate(
    geom = "text", # 注釈の形態にテキストを指定
    x = 91, y = 33, # 注釈を挿入する座標軸を指定
    label = "A surpriseingly high \n recovery rate", # 注釈の文字
    hjust = 0 # テキストの水平位置を調整。0の場合、テキストの左端が指定されたx座標に揃えられる
  )


.png)
.png)